
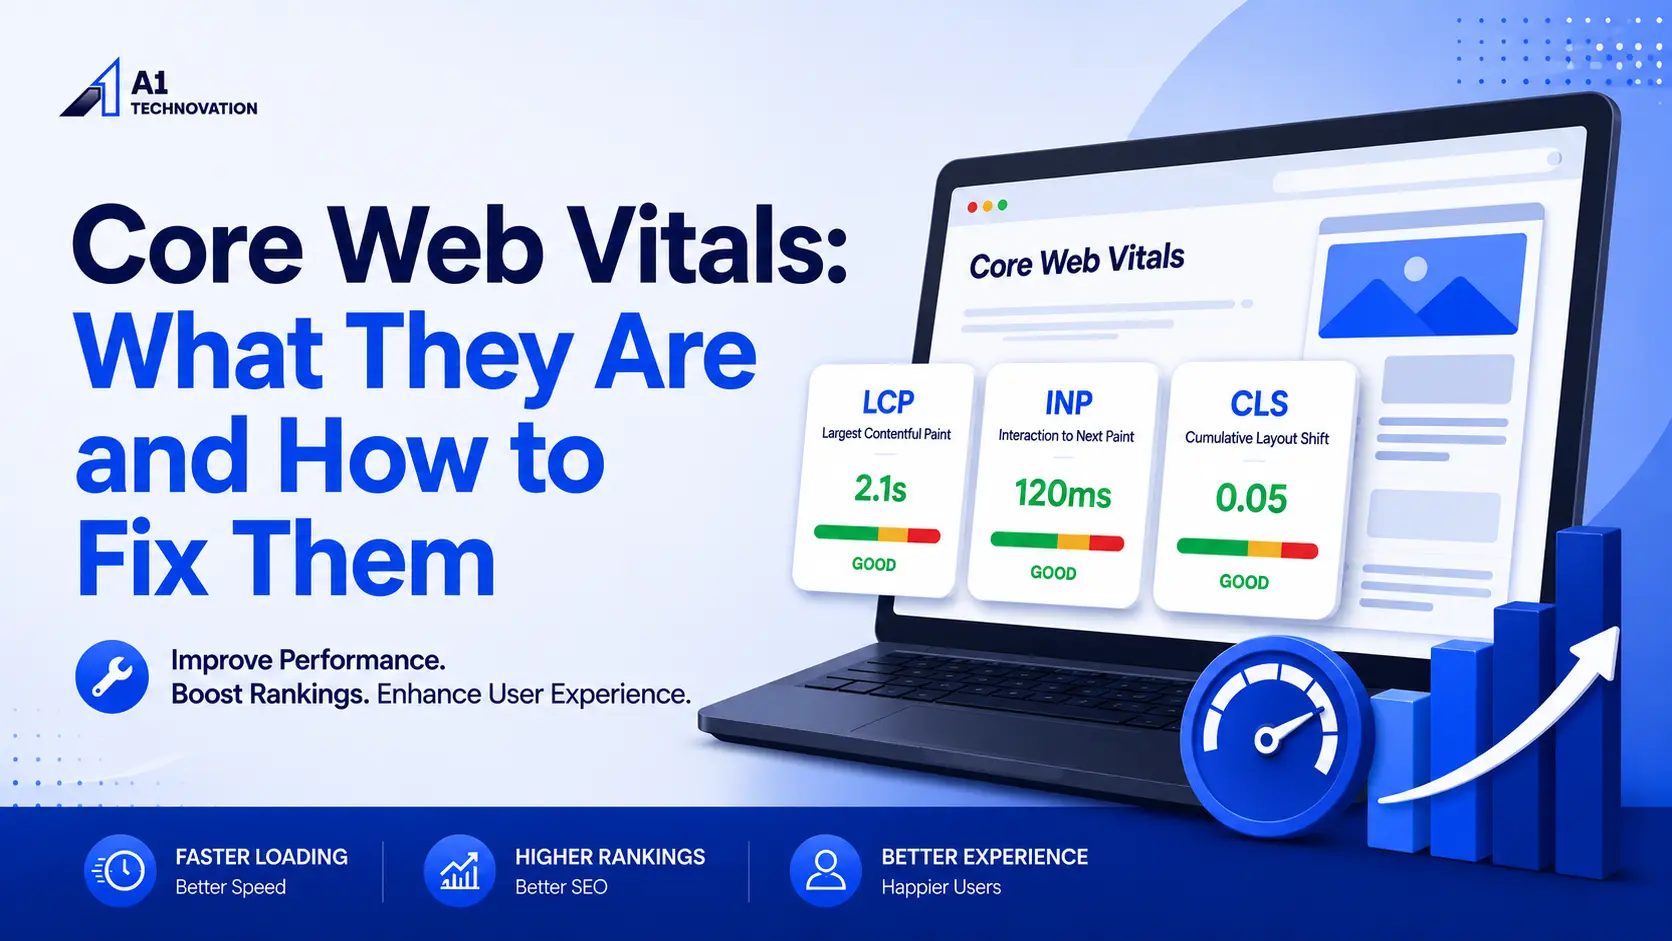
Core Web Vitals are three metrics Google uses to measure real user experience on a webpage. They cover loading speed through Largest Contentful Paint, responsiveness through Interaction to Next Paint, and visual stability through Cumulative Layout Shift. Google scores each metric using real visitor data from the Chrome UX Report, not lab simulations. As of the March 2026 update, a page needs an LCP under 2.0 seconds, an INP under 200 milliseconds, and a CLS under 0.1 to earn a Good rating at the 75th percentile.
We work on Core Web Vitals fixes for clients across the USA, UAE, Qatar, Saudi Arabia, and Bahrain every month. This guide breaks down each metric, the exact 2026 thresholds, the tools we use to diagnose problems, and the fixes that move the needle fastest.
What Are Core Web Vitals
Core Web Vitals form a subset of Google's page experience signals. They focus on three measurable parts of a visit: how fast the main content appears, how fast the page responds when someone clicks or taps, and how much the layout jumps around while loading.
Google built these metrics because older speed signals told an incomplete story. A page could load fast on paper and still feel sluggish to a real visitor. Core Web Vitals fix that gap by scoring the experience users actually feel, not just raw load time.
The table below shows all three metrics at a glance.
| Metric | What it measures | Good threshold (2026) | Needs Improvement | Poor |
|---|---|---|---|---|
| Largest Contentful Paint (LCP) | Loading speed of the main content | Under 2.0 seconds | 2.0s to 4.0s | Over 4.0 seconds |
| Interaction to Next Paint (INP) | Responsiveness to clicks, taps, and key presses | Under 200 milliseconds | 200ms to 500ms | Over 500ms |
| Cumulative Layout Shift (CLS) | Visual stability during load | Under 0.1 | 0.1 to 0.25 | Over 0.25 |
Google requires all three metrics to fall in the Good range at the same time. A site that passes LCP and CLS but fails INP still earns a Needs Improvement label, not a Good one. Each metric closes a separate gap, and Google treats the set as a single pass-fail bundle.
The 2026 Core Web Vitals Thresholds
Google tightened its Core Web Vitals standards in the March 2026 core update, and the change caught a large share of the web off guard.
LCP Threshold Change Explained
The Good LCP threshold dropped from 2.5 seconds to 2.0 seconds. A page that scored 2.3 seconds before March 2026 passed comfortably. That same page now lands in the Needs Improvement zone without a single code change. Sites with an LCP above 2.5 seconds saw average ranking drops of two to four positions on competitive queries after the update rolled out.
INP Threshold
INP keeps its 200 millisecond ceiling for a Good score, but Google raised its overall ranking weight. INP now carries equal weight alongside LCP and CLS instead of sitting as a secondary signal. Roughly 43% of sites still fail this threshold, which makes INP the most commonly failed Core Web Vital in 2026.
CLS Threshold
CLS keeps its 0.1 ceiling. A score above 0.25 still counts as Poor. CLS has stayed the most stable of the three metrics since launch, but it remains a frequent failure point on pages with ads, embeds, or web fonts that load late.
The 75th Percentile Rule
Google scores Core Web Vitals at the 75th percentile of real visitor sessions, not the average. A URL group only earns a Good rating when at least 75% of visits to those pages meet the Good threshold for all three metrics during the measurement window. This rule punishes inconsistency. A page that loads fast for most visitors but spikes badly for a smaller group can still fail.
Field Data vs Lab Data
Field Data comes from real visitors browsing your site with Chrome, collected through the Chrome UX Report. Lab Data comes from simulated tests run in controlled conditions through tools like Lighthouse. Google ranking systems use Field Data only. Lab Data stays useful for diagnosis and testing changes before they ship, but it never determines your ranking-facing score.
How Google Measures Core Web Vitals in 2026
Understanding the measurement system changes how you prioritize fixes.
Chrome UX Report (CrUX) Explained
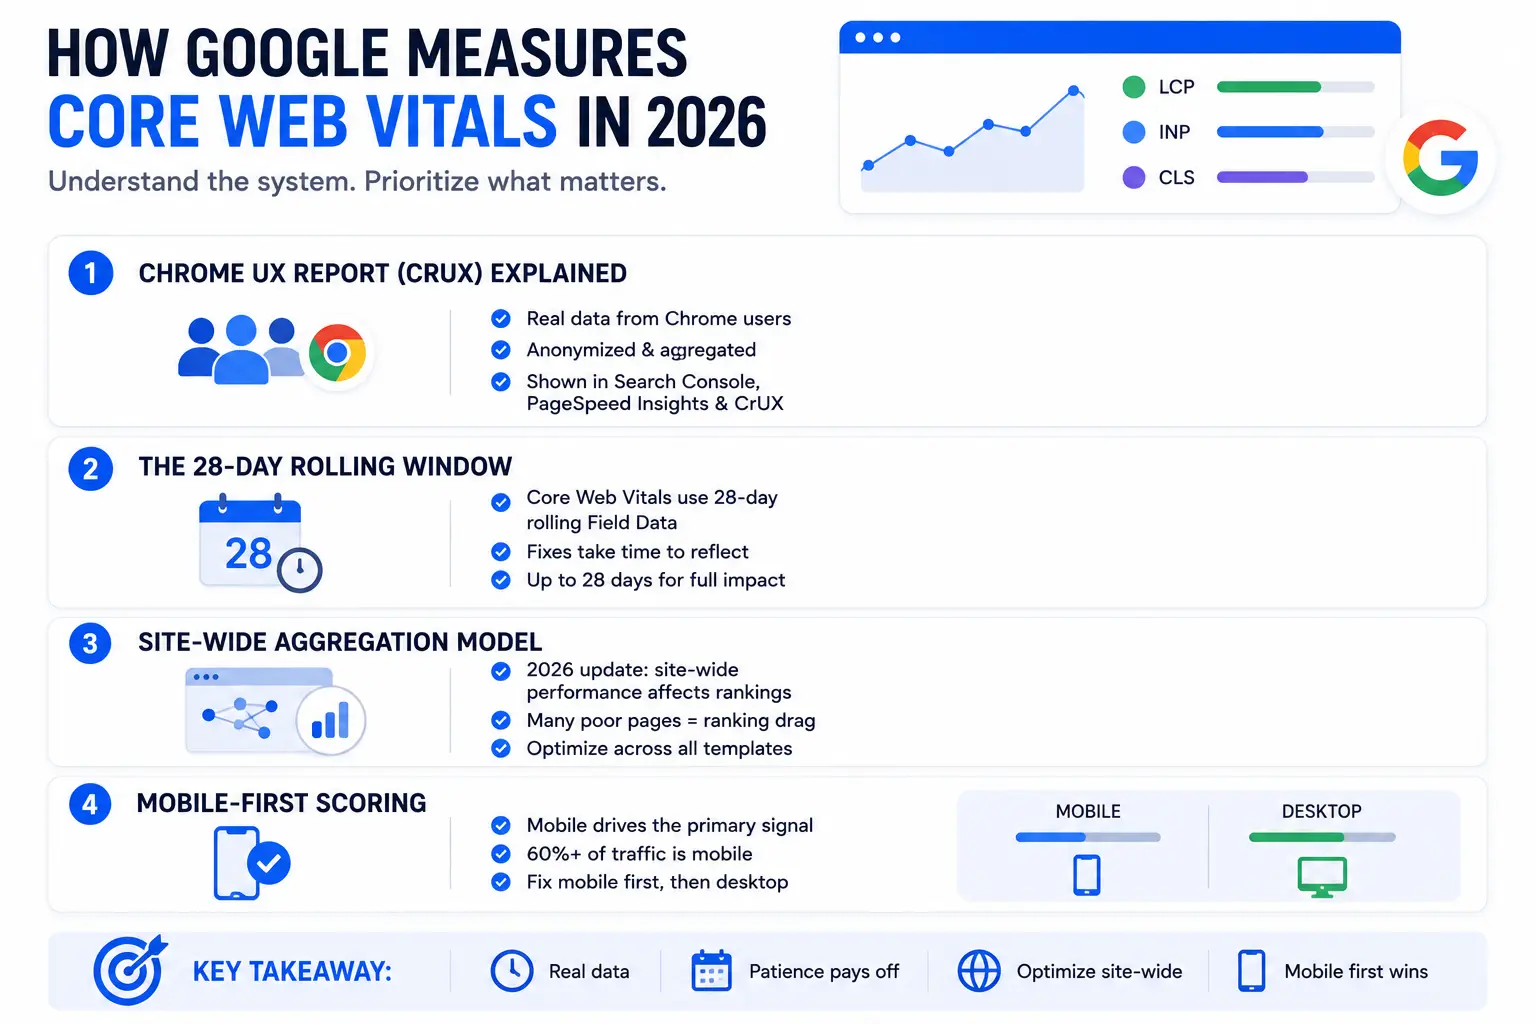
The Chrome UX Report collects anonymized performance data from real Chrome users who opt in to sync their browsing data and usage statistics. Google aggregates this data by URL and by origin, then exposes it through Search Console, PageSpeed Insights, and the public CrUX dataset.
The 28-Day Rolling Window
Search Console reports Core Web Vitals using a rolling 28-day window of aggregated Field Data. A fix you ship today does not appear instantly in your dashboard. Older, slower sessions stay mixed into the data until they age out of the 28-day window, so a real improvement can take close to a month to fully surface in your reports.
The Site-Wide Aggregation Model
The March 2026 update introduced a site-wide aggregation model for Core Web Vitals scoring. Google previously evaluated each URL on its own merit. The new model lets aggregate site performance influence how individual pages rank. A site where 40% of pages fail LCP now faces a broader ranking drag, even on the pages that pass. This single change explains why some sites that had optimized their top landing pages still saw declines after the March update. The fix can no longer stop at your homepage and a handful of priority pages. It has to extend across templates.
Mobile-First Scoring
Google evaluates mobile and desktop performance separately, but mobile now drives the primary signal under Mobile-First Indexing. Since mobile traffic accounts for more than 60% of search visits in 2026, a site with strong desktop scores and weak mobile scores still faces a ranking penalty. Fix mobile first, then confirm desktop holds steady.
Largest Contentful Paint (LCP): What It Is and How to Fix It
LCP measures the time it takes for the largest visible element, usually a hero image, video poster, or block of text, to fully render within the viewport. It approximates the moment a visitor perceives the page as loaded.
Common Causes of Poor LCP
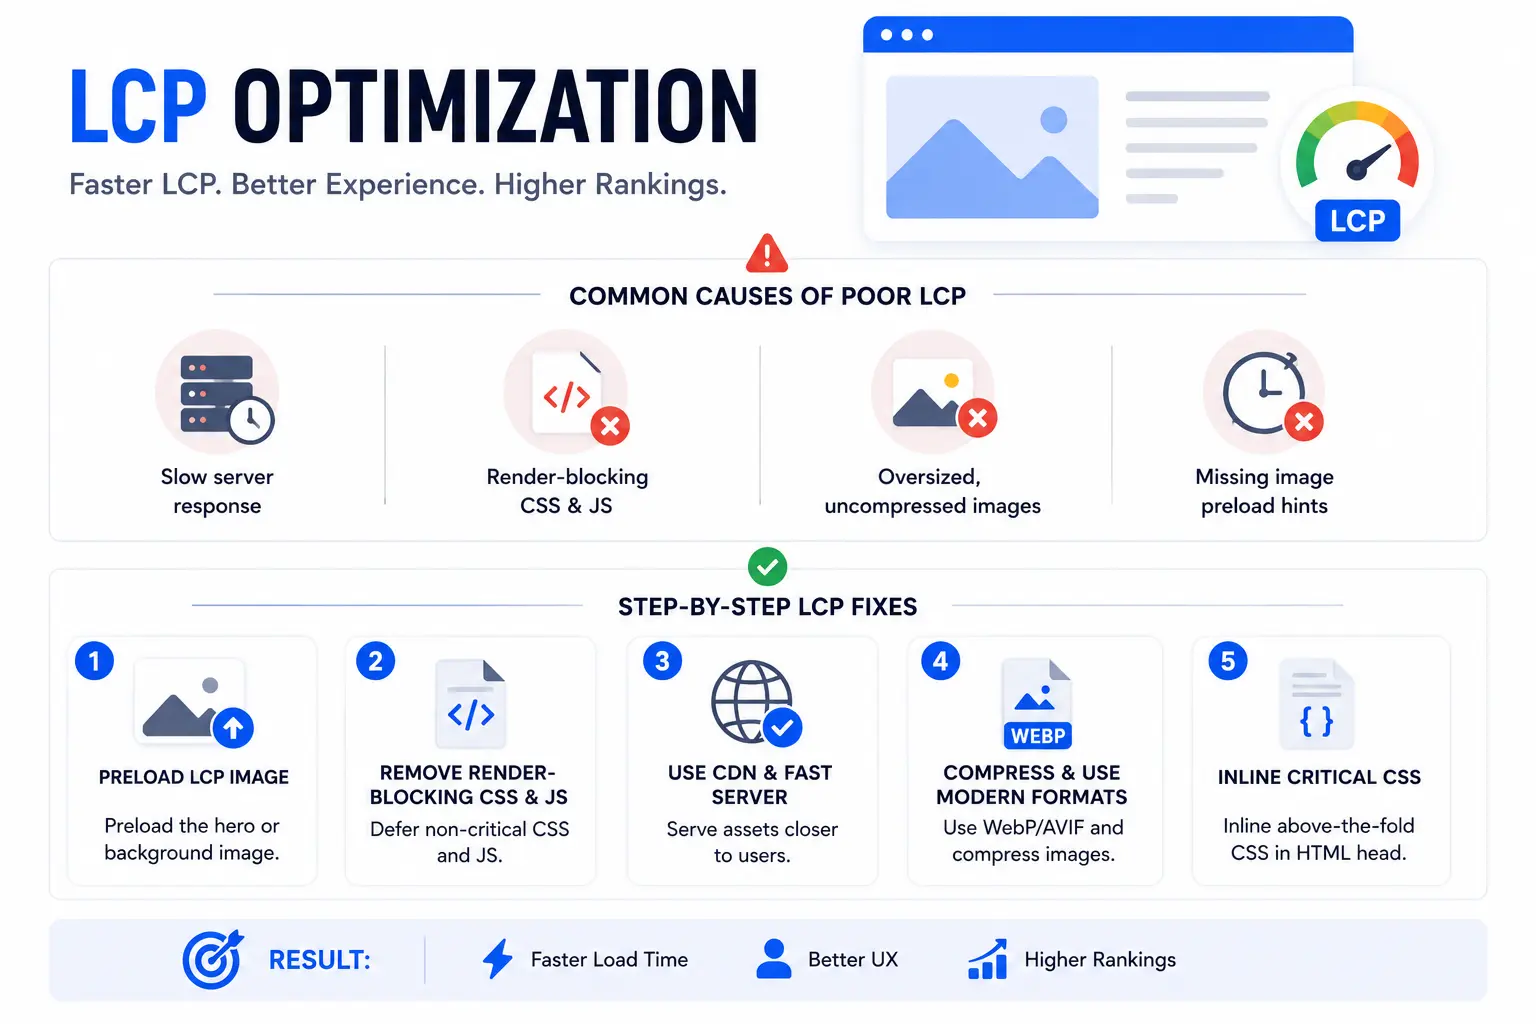
Slow server response time delays everything downstream, including the LCP element itself. Render-blocking CSS and JavaScript stop the browser from painting content until those files finish downloading and executing. Oversized, uncompressed images force the browser to spend extra time downloading and decoding before display. Missing image preload hints mean the browser finds the LCP resource too late in the loading sequence.
Step-by-Step LCP Fixes
Preload the LCP image. Add a <link rel="preload"> tag for the hero image or background image that renders as your largest element. This tells the browser to fetch that resource immediately instead of waiting for the normal resource-finding process.
Remove render-blocking CSS and JS. Move non-critical CSS to load asynchronously and defer JavaScript that does not affect the initial paint. Use the defer or async attributes on script tags that are not required for the first render.
Use a CDN and faster server response. A content delivery network places your assets closer to the visitor, which cuts network latency. Pair this with a hosting environment that returns the initial HTML response quickly, since every millisecond of server delay pushes LCP back directly.
Compress and modernize image formats. Convert hero images to WebP or AVIF, which produce smaller file sizes than JPEG or PNG at comparable quality. Compress every image before upload instead of relying on the browser to handle oversized files.
Inline critical CSS. Extract the CSS rules needed for above-the-fold content and inline them directly in the HTML head. This removes one network round trip from the critical rendering path and lets the browser paint sooner.
Interaction to Next Paint (INP): What It Is and How to Fix It
INP measures how long it takes for the page to visually respond after a visitor clicks, taps, or presses a key. Unlike its predecessor, INP tracks every interaction during a visit and reports the worst representative value, not just the first one.
What INP Measures and Why It Replaced FID
First Input Delay only measured the delay before the browser began processing the first interaction. It ignored everything that happened afterward. INP closes that gap by scoring the full lifecycle of an interaction: input delay, processing time, and the time until the next frame paints. Google retired FID and made INP the official responsiveness metric in March 2024, and the stricter scope is exactly why more sites fail it.
Common Causes of Poor INP
Long JavaScript tasks block the main thread and delay every interaction queued behind them. Heavy third-party scripts, including ad tags, chat widgets, and analytics tools, often run expensive code that competes for the same thread. Large component re-renders in JavaScript frameworks can repaint more of the page than necessary after a simple click. Unoptimized event handlers that run synchronous, expensive logic on every keystroke or click add delay that compounds across a session.
Step-by-Step INP Fixes
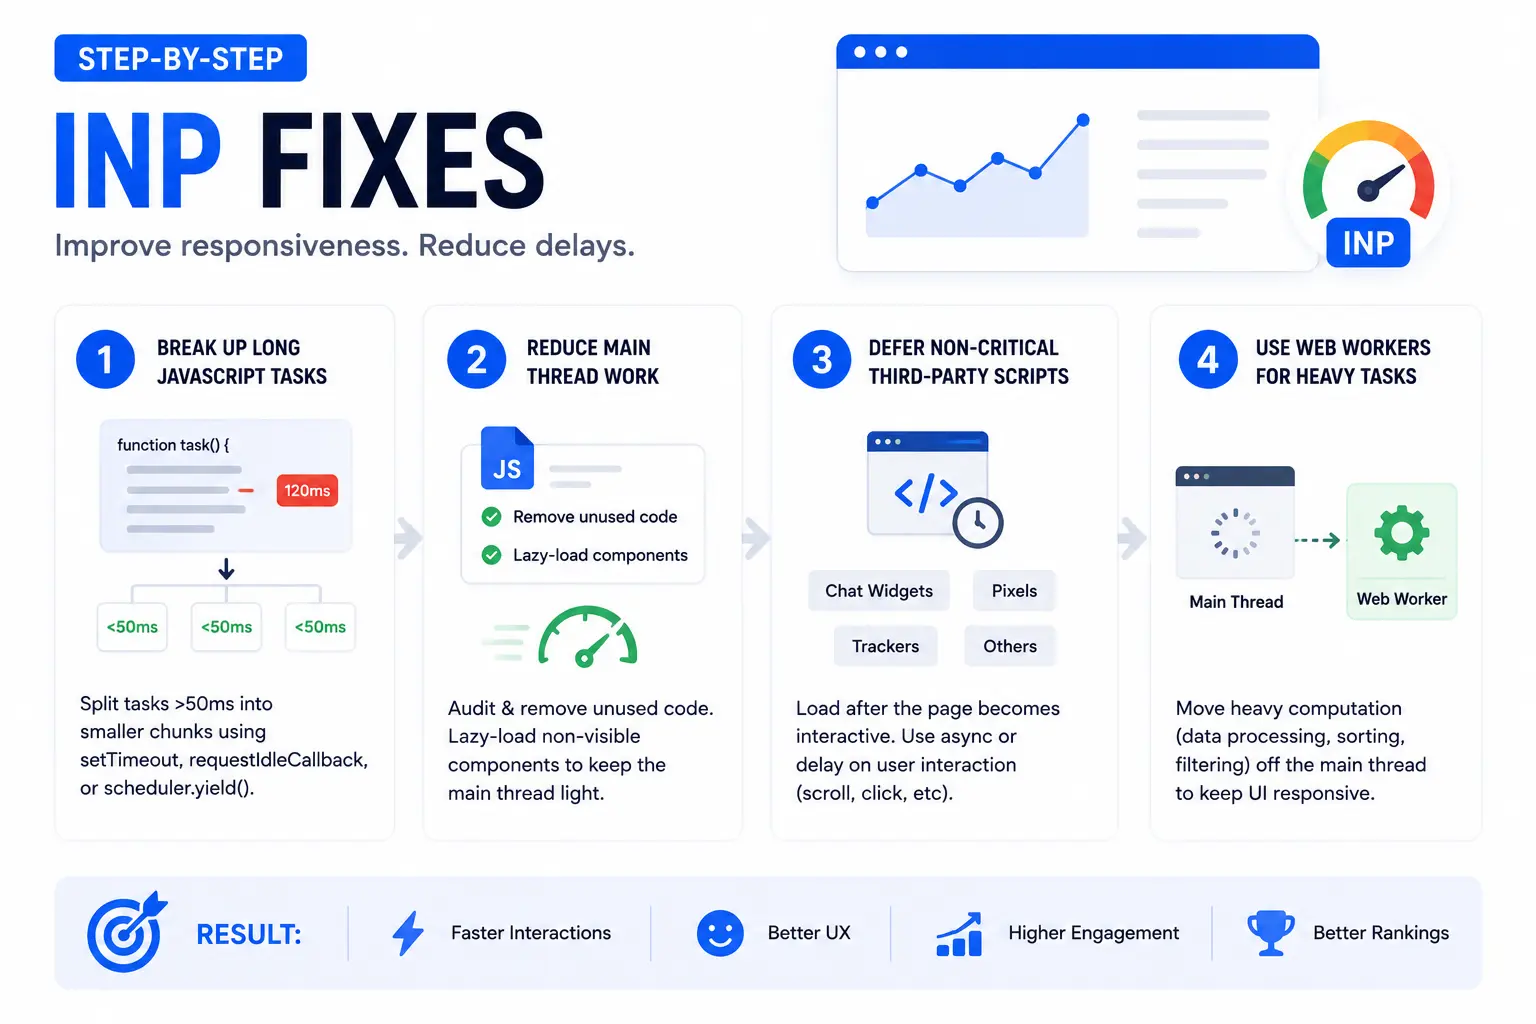
Break up long JavaScript tasks. Split tasks that run longer than 50 milliseconds into smaller chunks using setTimeout, requestIdleCallback, or the scheduler.yield() API. This frees the main thread to handle user input between chunks instead of finishing one long block first.
Reduce main thread work. Audit your JavaScript bundle for unused code and remove it. Lazy-load components that are not visible on initial render. Smaller bundles parse and execute faster, which leaves more main thread capacity for responding to input.
Defer non-critical third-party scripts. Load chat widgets, marketing pixels, and non-essential trackers after the page becomes interactive, not during initial load. Use async loading or load these scripts on a delay tied to user interaction, such as a scroll or click event.
Use web workers for heavy computation. Move CPU-intensive tasks like data processing, sorting, or filtering off the main thread and into a web worker. This keeps the main thread free to respond to clicks and taps while the heavy work runs in parallel.
Cumulative Layout Shift (CLS): What It Is and How to Fix It
CLS measures how much visible content shifts position during the loading process. Every unexpected shift adds to a cumulative score, and a higher score means a less stable page.
What CLS Measures
Google calculates CLS by multiplying the impact fraction of a shift, how much of the viewport moved, by the distance fraction, how far it moved. The sum of every unexpected shift during the page lifecycle produces the final score.
Common Causes of Layout Shift
Images and videos without defined dimensions cause the page to reflow once the file finishes loading and the browser learns its true size. Ads, embeds, and iframes injected without reserved space push surrounding content down or sideways. Web fonts that load after a fallback font has already rendered text can change line length and cause a visible jump. Content inserted above existing content, such as a banner or notification that appears after the user starts scrolling, pushes everything below it.
Step-by-Step CLS Fixes
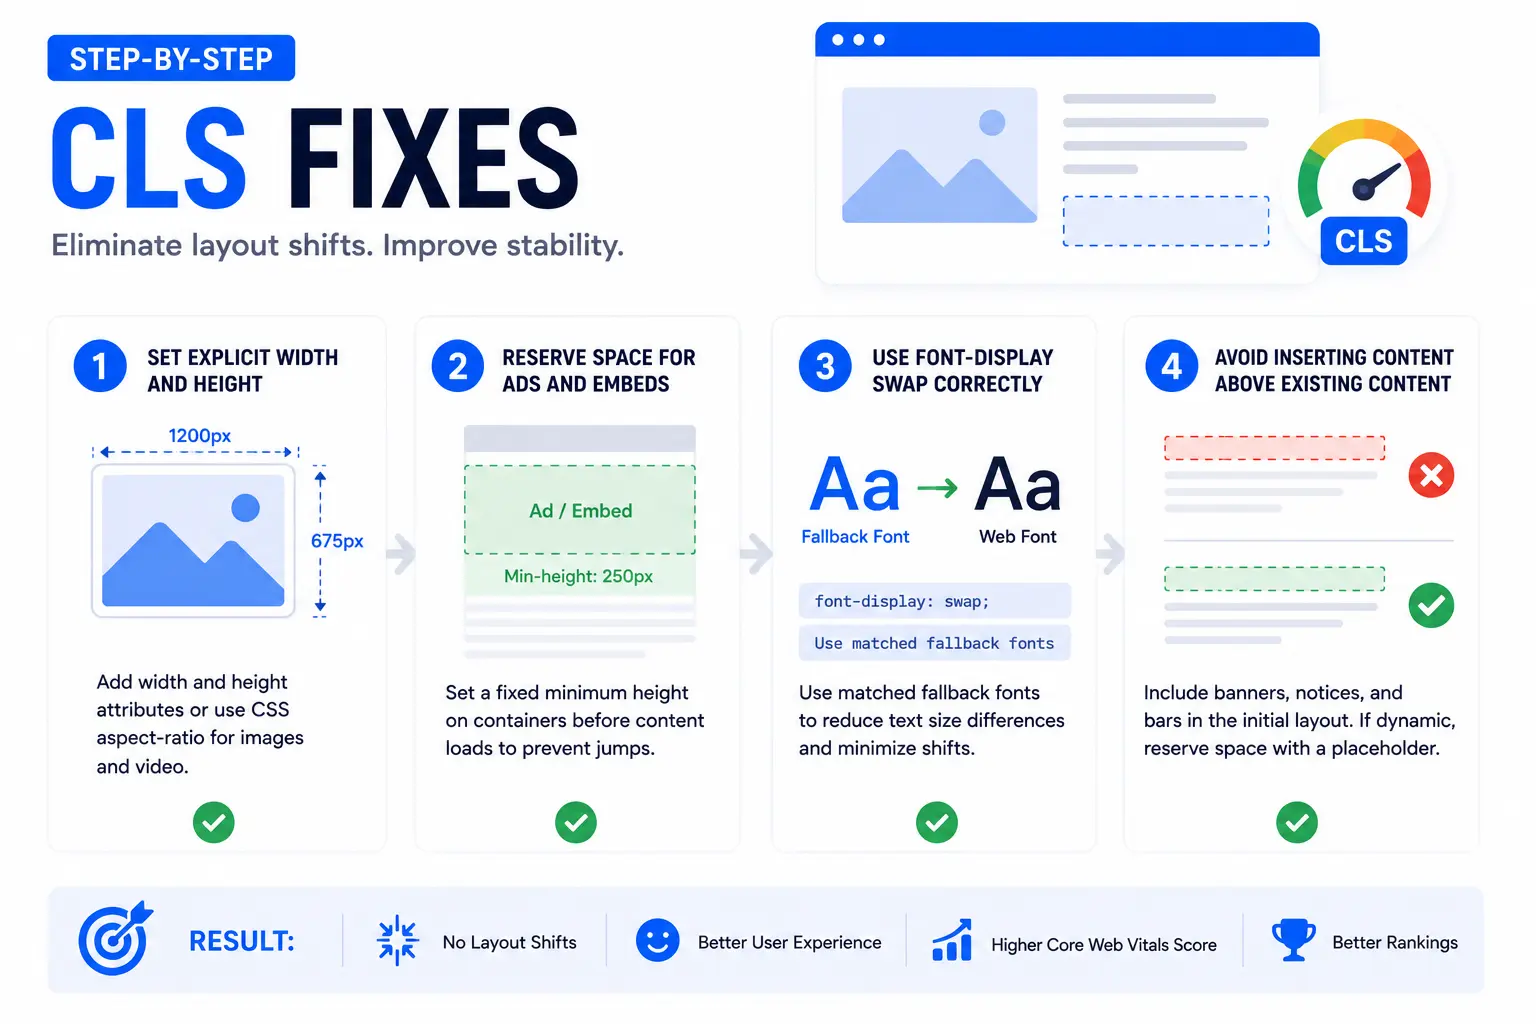
Set explicit width and height on images and video. Define dimension attributes or use CSS aspect-ratio on every image and video element. The browser then reserves the correct amount of space before the file finishes downloading, which prevents the reflow entirely.
Reserve space for ads and embeds. Set a fixed minimum height on ad containers and embed wrappers before the ad network or third-party script populates them. This stops the surrounding layout from jumping once the content loads.
Use font-display swap correctly. Pair font-display: swap with matched fallback fonts that share similar metrics to your web font. This reduces the size difference between the fallback text and the final text, which shrinks the visible jump when the web font finishes loading.
Avoid inserting content above existing content. Build banners, cookie notices, and promotional bars into the initial layout instead of injecting them after the page has already rendered. If dynamic insertion is unavoidable, reserve the space in advance with a placeholder.
How to Check Your Core Web Vitals Scores
Each diagnostic tool serves a different purpose, and using the right one first saves time.
Google Search Console Core Web Vitals Report
Open Search Console and go to Experience, then Core Web Vitals. This report shows real Field Data grouped by URL pattern, which tells you which templates need attention across your entire site rather than one page at a time. Start every audit here, since this report reflects the same aggregated data Google uses for ranking.
PageSpeed Insights
PageSpeed Insights combines Field Data for your specific URL, when enough traffic exists, with a Lab Data Lighthouse audit. Visit pagespeed.web.dev, enter your URL, and review the Opportunities and Diagnostics sections for specific, prioritized fixes.
Chrome DevTools and Lighthouse
Lighthouse, built into Chrome DevTools, generates a detailed Lab Data performance audit you can run during development before a change ships. Use the Performance panel in DevTools to record a session and inspect the exact tasks blocking your main thread.
WebPageTest for Deep Diagnosis
WebPageTest simulates page loads under controlled network and device conditions, then breaks down every request in a waterfall chart. Use it when PageSpeed Insights and Lighthouse point to a problem but you need to isolate the exact script or resource causing it.
Core Web Vitals and SEO Rankings
Google confirmed Core Web Vitals as a ranking signal during the 2021 Page Experience Update, and the signal has carried more weight every year since.
How Much Core Web Vitals Affects Rankings
Industry research from 2026 places Core Web Vitals at roughly 10% to 15% of total ranking signals. That share makes Core Web Vitals a meaningful factor, but not the dominant one. Sites that pass all three thresholds report an 8% to 15% visibility boost on competitive queries compared to sites that fail one or more metrics.
Core Web Vitals as a Tiebreaker
Core Web Vitals function best as a tiebreaker. Two pages with comparable content quality and topical depth will not rank the same. The page with better Core Web Vitals scores tends to win the higher position. Strong performance cannot rescue thin or low-value content, and weak performance can hold back content that would otherwise rank well. The two factors work together, not as substitutes for each other.
Core Web Vitals and AI Search Visibility
Fast, stable pages also improve citation odds in Answer Engine Optimization and Generative Engine Optimization contexts. AI engines like ChatGPT, Gemini, and Perplexity retrieve and parse content more reliably from pages that load quickly and render a stable DOM structure. A page that shifts layout or delays content rendering makes the retrieval process harder for these systems, which lowers the odds of getting cited even when the underlying content answers the query well. We treat Core Web Vitals as part of our AEO and GEO process for this exact reason: a page has to be retrievable before it can be citable.
A Real Fix Example
[Note for review before publishing: replace this section with a verified before-and-after data point from an A1 Technovation client project. Confirm exact LCP, INP, or CLS values and get client permission to reference the result, anonymized if required, before this page goes live.]
We document every Core Web Vitals fix with before-and-after field data, not lab estimates, since lab improvements do not always translate into ranking-facing gains. A typical fix sequence on a client site starts with the Search Console report, moves to a template-level audit instead of a single-URL fix, and confirms improvement only after a full 28-day Field Data cycle.
Core Web Vitals Monitoring Checklist
- Check the Search Console Core Web Vitals report at least once a month.
- Set internal alert thresholds below Google's pass line, such as LCP above 1.8 seconds or INP above 160 milliseconds, to catch problems early.
- Run a Lighthouse audit in staging before every major deploy.
- Review third-party scripts every quarter and remove any that no longer earn their performance cost.
- Set explicit dimensions on every new image, video, and embed added to the site.
- Re-check mobile scores separately from desktop scores after every theme or template change.
- Wait for a full 28-day Field Data cycle before judging whether a fix worked.
FAQ
What are Core Web Vitals in simple terms?
Core Web Vitals are three scores that show how fast a page loads, how quickly it responds to clicks or taps, and how stable the layout stays while loading. Google uses these scores as part of its ranking system.
What changed with Core Web Vitals in 2026?
Google lowered the Good LCP threshold from 2.5 seconds to 2.0 seconds in March 2026. Google also moved to a site-wide aggregation model, so pages across a domain now affect each other's scores instead of standing alone.
Is INP harder to pass than FID was?
Yes. INP measures every interaction during a visit, not just the first one. FID only checked the first click or tap. INP gives a stricter and more complete picture of real responsiveness.
Do Core Web Vitals affect my Google rankings directly?
Core Web Vitals act as a tiebreaker. If two pages offer similar content quality, the page with better Core Web Vitals scores tends to win the higher position.
What tool should I use first to check my scores?
Start with Google Search Console's Core Web Vitals report. It shows real Field Data grouped by URL pattern, which tells you which templates need attention before you run deeper Lighthouse or WebPageTest audits.
Can good Core Web Vitals fix weak content?
No. Core Web Vitals improve user experience and can support rankings, but they cannot replace thin or low-value content. Strong content paired with strong performance produces the best result.
How often should I check my Core Web Vitals scores?
Check monthly at minimum, and immediately after any major deploy, theme change, or new third-party script addition. Field Data updates on a rolling 28-day basis, so changes take time to fully reflect in reports.
Get Your Core Web Vitals Fixed
Our technical SEO team audits, prioritizes, and fixes Core Web Vitals issues across full site templates, not just individual pages. Explore our technical SEO services to see how we approach a full Core Web Vitals fix, or read our complete technical SEO guide for the broader framework these fixes fit into. Performance is one input into AI search visibility, and we treat it as a required step, not an optional one, inside every SEO services engagement.
Go deeper on the technical layer
These companion pages connect Core Web Vitals work with broader technical SEO and AI visibility decisions.
Written by Likhon Ahmed, Founder and CEO of A1 Technovation. Likhon has 7+ years of hands-on SEO experience working with 150+ clients across the USA, UAE, Qatar, Saudi Arabia, and Bahrain. A1 Technovation has been a full-stack digital marketing agency since 2018, specializing in technical SEO, AEO, and GEO for businesses that need to rank on Google and get cited by AI engines.
Need Help Fixing Core Web Vitals Across Your Site?
A1 Technovation helps teams diagnose template-level speed, interaction, and layout issues that hold back rankings and user experience.
Talk to our team →